

You know which jobs will make money when you can produce a job-level P&L that matches estimate line items to real-time actuals and shows a positive cost-to-complete projection. That's the whole game. Everything else, the bid strategy, the crew scheduling, the change-order discipline, is just execution around that core diagnostic.
Three quick pre-bid filters let you triage any opportunity in under 15 minutes:
- Scope clarity: Can you define the work clearly enough to price it? Vague scopes become expensive surprises.
- Payment terms and GC reliability: Net-60 with a GC who pays slow destroys cashflow even on a profitable job.
- Schedule and site logistics: Phase-gated specialty work (electrical, HVAC/mechanical, fire protection) is uniquely exposed to schedule slippage. If the GC's timeline is already compressed, your labor costs will be too.
If more than two of those filters raise a red flag, the right answer is usually to pass. Contractors who implement rigorous job costing earn approximately 2.3× higher net margins, according to FMI data. That gap is not about working harder. It's about knowing which jobs to take and catching overruns before they close.
Table of Contents
- Essential job-level metrics every estimator and PM must track
- How to build a pre-bid job-level P&L in 15–30 minutes
- Bid/no-bid checklist: quick filters estimators use to say yes or no
- Track jobs while they're live so you know profit before close
- Common profit killers on specialty-trade jobs and how to fix them
- Tools that actually help you know which jobs make money
- How to set realistic profit targets for different job types
- Methods to analyze market demand and pricing trends affecting job profitability
- Early warning signs of unprofitability beyond cost overruns
- Strategies for adjusting bids dynamically based on historical job data
- Key Takeaways
- What I watch first on Monday morning
- Subascent gives you job-level P&Ls without the spreadsheet work
- Sources and further reading
Essential job-level metrics every estimator and PM must track
Your company P&L tells you whether the business made money. A job-level P&L tells you why. Without it, you're flying blind on every active job.
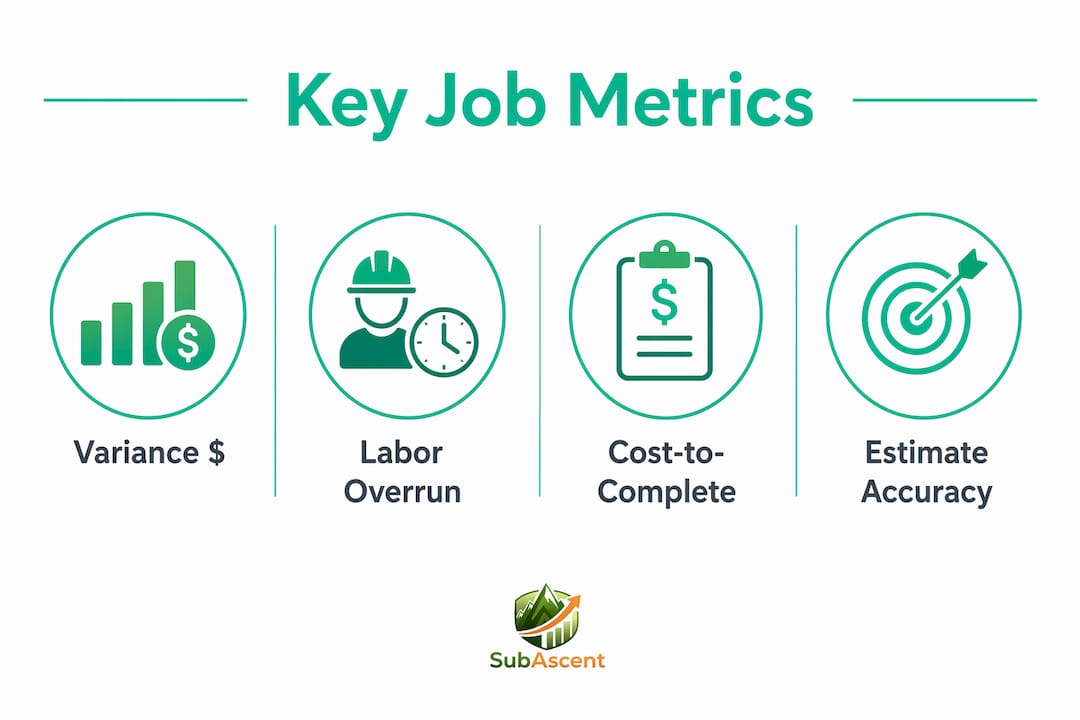
Track these eight metrics on every project:
- Contract value (the revenue ceiling)
- Estimated direct cost (labor, materials, subs, equipment, general conditions)
- Estimated gross margin % (your target going in)
- Actual cost to date (coded by cost code, not just total spend)
- Cost-to-complete (your best current forecast of remaining spend)
- Variance in dollars and percent per cost code
- Labor productivity (hours per unit installed, by phase)
- Backlog-adjusted net contribution (what this job adds after overhead)
| Formula | Calculation |
|---|---|
| Variance $ | Estimated cost minus actual cost to date minus cost-to-complete |
| Variance % | Variance percentage |
| Actual gross profit | Contract value minus total actual cost |
| Cost-to-complete projection | Estimated cost minus actual cost to date, adjusted for productivity rate |
Flag any cost line that is more than 10% over estimate with more than 20% of work remaining. Labor running 15–25% over estimate is common when daily field time tracking is not in place. That's the threshold where a recoverable overrun becomes a loss.

Pro Tip: Standardize your estimate breakdown so cost codes map 1:1 to your actual tracking. Without that alignment, variance numbers are meaningless — you're comparing apples to a spreadsheet full of guesses.
How to build a pre-bid job-level P&L in 15–30 minutes
Produce a one-page job P&L showing estimated revenue, itemized costs, contingency, and an initial gross margin target. Here's the repeatable workflow:
- Gather the contract price and scope of work. Confirm what's included and, critically, what's excluded.
- Break the estimate into cost codes. Labor by phase, materials, subcontractors, equipment, general conditions, permits, and other direct costs. Don't forget frequently missed items like supervision time, temp utilities, dumpsters, and inspections.
- Add contingency. For well-defined scopes, 3–5% is reasonable. For complex or fast-track work, go 6–8%.
- Allocate overhead and owner pay. Apply as a fixed percentage of contract value or a per-job charge, consistently across all bids.
- Calculate net contribution. Estimated gross profit minus overhead allocation equals the job's contribution to the business.
At closeout, finalize all costs, calculate variance by category, document three lessons learned, and update your estimating unit costs. That feedback loop is what makes the next bid more accurate.
Bid/no-bid checklist: quick filters estimators use to say yes or no
If more than two items below are red flags, consider passing. Time spent on a bad bid is time not spent winning a good one.
- Scope clarity and change-order risk: Is the scope defined well enough to price? Who controls change orders?
- Payment terms and retention: Net-30 or better is the baseline. Retention above 10% ties up cashflow.
- GC reputation and payment history: Call two mutual subs. Check AR aging on any prior work with this GC.
- Schedule constraints: Is the GC's schedule realistic? Compressed timelines hit labor-intensive trades hardest.
- Crew availability: Do you have the right crew available for the start date, or will you be scrambling?
- Cashflow impact: Does this job's payment cycle create a gap that strains operations?
- Bond and insurance requirements: Confirm bonding capacity before committing. Unexpected bond costs cut margin fast.
- Competitive pricing pressure: Is this a 10-bidder free-for-all, or a shortlist where you have a real shot?
Pro Tip: A three-minute GC check: call two subs who worked with this GC in the last 12 months, pull the last three public projects for schedule slippage, and check your own AR aging if you've worked with them before. That's enough to make a confident call.
For plumbing, HVAC/mechanical, and fire protection crews especially, hiring timelines affect project schedules more than most estimators account for. Build that lead time into your bid/no-bid decision.
Track jobs while they're live so you know profit before close
Run a short daily and weekly loop that turns field inputs into a rolling cost-to-complete and a variance check. Catching a problem at the rough-in phase gives you options. Catching it at closeout gives you a lesson.
- Daily: Collect crew hours by phase, code receipts on delivery, log sub invoices immediately.
- Weekly: Compare hours-to-date versus estimated hours-to-date by phase. Update cost-to-complete. Flag any category over the 10%/20% threshold.
- Monthly: Reconcile committed costs versus billed. Update the job P&L and review with the PM.
| Cadence | What to Collect |
|---|---|
| Daily | Labor hours by phase, key materials received, change events |
| Weekly | Cumulative cost vs. estimate, committed costs, productivity rate |
| Monthly | Final committed vs. billed reconciliation, updated job P&L |
A weekly one-page job health report covering budget versus actual, top variances, and named corrective actions is one of the most effective margin controls available. The key word is "named." A variance with no owner and no deadline doesn't get fixed.
Pro Tip: Review budget-versus-actual at phase gates, not just month-end. For a framing or drywall job, that means checking at rough-in complete. You still have time to adjust crew size or sequencing. After final inspection, you're just documenting the loss.
Common profit killers on specialty-trade jobs and how to fix them
The most frequent causes of margin loss on electrical, plumbing, roofing, and masonry jobs follow a short list. Most are fixable if you catch them early.
- Labor overruns: Tighten daily time tracking. Reset crew productivity targets by phase. Track hours per unit installed against your estimate baseline.
- Scope creep and uncaptured change orders: Require a signed change order before work proceeds. No exceptions. Verbal approvals become disputes.
- Incorrect cost coding: Retrain foremen and admins. Run weekly job-cost audits to catch miscoded hours before they compound.
- Material escalation: Lock pricing at bid time or add an explicit escalation allowance. Don't absorb market swings silently.
- Subcontractor underperformance: Enforce performance clauses. Retain contingency until milestones are met.
- Schedule slippage: Treat schedule delays as a cost event immediately. Reassign crew or escalate to the GC in writing.
The fixes that move the needle fastest are labor controls, change-order discipline, and committed-cost tracking, in that order. Without daily time tracking, expect labor overruns of 15–25% and plan your contingency accordingly.
For more on the full list of margin leaks, the 8 profit killers for subs breakdown covers each one with corrective actions.
Tools that actually help you know which jobs make money
The right tool ties estimate line items to job actuals, captures daily crew hours by phase, syncs committed costs, and integrates with QuickBooks for accurate accounting. Without those four capabilities, you're still reconciling manually at month-end.
Capabilities to evaluate before choosing any platform:
- 1:1 cost-code mapping between estimate and actuals (without this, variance reports are noise)
- Mobile crew time capture so foremen log hours by phase in the field, not from memory on Friday
- Committed-cost and change-order logging in real time
- Real-time job P&L and cost-to-complete forecasting
- QuickBooks sync for accounting reconciliation without double entry
- Lightweight weekly dashboard for one-page job health checks
Job costing software users catch budget overruns roughly three or more weeks earlier than spreadsheet users. That's the window where corrective action is still possible.
Subascent is built specifically for specialty-trade subcontractors, covering electrical, plumbing, HVAC/mechanical, masonry, concrete, framing, drywall, roofing, fire protection, low-voltage, painting, flooring, glazing, insulation, and steel/rebar. It provides job-level P&L, estimate-to-actual cost-code mapping, and real-time profit analytics. CrewTrack, Subascent's free mobile app for foremen, handles daily crew hour capture by phase without requiring foremen to touch a desktop. QuickBooks integration closes the loop between field costs and accounting, eliminating the manual reconciliation that delays margin visibility.
For a deeper look at what to look for in the category, the construction software gaps for subs guide covers why GC-built platforms miss the mark for specialty trades.
Pro Tip: Standardize cost-code mapping between estimating and field reporting before buying any software. That single change is the highest-leverage move a small trade contractor can make. Software automates a working process; it doesn't fix a broken one.
How to set realistic profit targets for different job types
Gross margin targets vary by trade, job complexity, and risk profile. A straightforward painting or flooring job with defined scope and short duration can run at a lower margin because execution risk is low. A fire protection or low-voltage job with multiple phase gates, GC coordination, and inspection dependencies carries more risk and should price accordingly.
A practical starting point: set a floor gross margin by job type based on your last 12 months of closed jobs. If your electrical rough-in work averaged 22% gross margin on jobs that closed cleanly, that's your baseline. Jobs with compressed schedules, unfamiliar GCs, or complex phasing should target 25–30% to absorb the additional risk.
Overhead allocation matters here. A job that looks profitable at the gross margin line can still lose money if overhead is not fully loaded. Assign overhead as a consistent percentage of contract value across all job types so comparisons are apples-to-apples.
Methods to analyze market demand and pricing trends affecting job profitability
Pricing trends hit specialty trades through two channels: material costs and labor market rates. Both shift faster than annual bid reviews can track.
For materials, check supplier pricing monthly on your top five commodity lines (copper, steel, drywall, PVC, insulation). If a line has moved more than 5% since your last bid, update your unit costs before the next estimate goes out. Locking supplier pricing at bid time, even for 30 days, protects margin on fast-moving jobs.
For labor, track your burdened labor rate against local market rates quarterly. Plumbing subcontractor staffing costs, for example, shift with regional demand cycles. If your burdened rate is below market, you may be underpricing labor risk. If it's above, you may be losing bids you should be winning.
Bid win rate by job type is an underused demand signal. If you're winning 60% of masonry bids but only 20% of roofing bids at the same margin target, the market is telling you something about your pricing position in each category.
Early warning signs of unprofitability beyond cost overruns
Cost overruns are the obvious signal. These are the ones most PMs miss until it's too late:
Scope creep without paperwork. If the foreman is doing work that wasn't in the original estimate and there's no signed change order, that cost is coming out of your margin. The warning sign is field hours that don't match the phase plan, not a budget line going red.
Change order approval delays. A GC who takes three weeks to approve a change order is a GC who may dispute it at closeout. Log every change event in writing the day it happens, regardless of approval status.
Productivity fade mid-job. If labor hours per unit installed were on track through rough-in and then slowed 15% in the trim phase, something changed: crew composition, site conditions, or rework. Catching productivity fade at the phase gate, not at closeout, is the difference between a corrective action and a write-off.
Billing lag. If costs are accumulating faster than invoices are going out, cashflow pressure builds and margin visibility drops. A job that's technically profitable can create a serious cash problem if billing is two weeks behind costs.
Strategies for adjusting bids dynamically based on historical job data
Your closed-job data is the most accurate pricing database you have. Use it.
After every job closes, calculate variance by cost code and document three lessons learned. Update your estimating unit costs based on actuals, not on what you hoped the job would cost. Over 12 months, this process tightens your estimates and raises your win rate on the right jobs.
When building a new bid, pull the two or three most similar closed jobs and compare their cost-code actuals to your current estimate. If your framing labor estimate is 15% below what similar jobs actually cost, you have a choice: adjust the estimate or price in the risk explicitly.
Bid markup should also respond to win rate. If you're winning more than 40% of contested bids, you may be leaving margin on the table. Raise your markup on the next five similar bids and measure the impact. If win rate drops to 20–25%, you've found the market ceiling. That's a data-driven pricing strategy, not guesswork.
Key Takeaways
Contractors who track job-level P&Ls with rigorous cost-code discipline earn approximately 2.3× higher net margins than those who don't, and catching labor overruns early is the single fastest way to protect that gap.
| Point | Details |
|---|---|
| Run a pre-bid P&L every time | Produce a one-page job P&L for every contested bid before committing resources. |
| Require daily crew hours by phase | Without daily field time capture, labor overruns on active jobs are common. |
| Apply the 10%/20% alert rule | Flag any cost code more than 10% over estimate with more than 20% of work remaining. |
| Treat labor as the highest-risk line | Labor overruns are the most frequent cause of margin loss on specialty-trade jobs. |
| Subascent for job-level visibility | Subascent provides 1:1 estimate-to-actual mapping, CrewTrack mobile time capture, and QuickBooks sync for real-time job P&Ls. |
What I watch first on Monday morning
The first thing I pull up on Monday is cost-to-complete on every active job and any labor lines trending more than 10% over estimate. Not the company P&L. Not the bank balance. The job-level numbers, because that's where problems are still fixable.
The clearest example of why this matters: catching a labor overrun at rough-in complete on an electrical job. Hours were running about 18% over estimate on the panel rough-in phase. The fix wasn't adding crew. It was resequencing: moving the two most productive journeymen to the panel work and shifting the apprentice to conduit runs where the pace mattered less. The job closed within 3% of the original margin target.
That kind of correction is only possible if you're looking at phase-level labor data during the job, not after it. A company P&L would have shown a profitable quarter. The job-level data showed exactly where the money was going and gave enough runway to do something about it.
Subascent gives you job-level P&Ls without the spreadsheet work
Most specialty-trade subs already know their jobs should be more profitable. The gap is visibility: costs accumulate in the field, estimates sit in a workbook, and the reconciliation happens too late to change anything.

Subascent closes that gap. It's built specifically for electrical, plumbing, HVAC/mechanical, masonry, concrete, framing, drywall, roofing, fire protection, low-voltage, painting, flooring, glazing, insulation, and steel/rebar businesses with 1–50 employees. The platform maps estimate cost codes directly to job actuals, so variance reports are accurate from day one. CrewTrack, the free foreman mobile app, captures daily crew hours by phase without requiring foremen to leave the field. QuickBooks sync means your accounting and your job costs stay aligned without manual entry.
- Built-for-trade estimate templates with phase-level cost codes
- Daily crew hour capture via CrewTrack mobile
- Change-order logging tied to the job P&L
- Real-time cost-to-complete forecasting
- QuickBooks integration for accounting reconciliation
Start a free trial at Subascent and run your first job-level P&L this week.
Sources and further reading
The claims and frameworks in this article draw on the following sources. Each is worth reading in full if you're implementing job costing or budget-versus-actual analysis for the first time.
- Construction Job Costing: How to Track Profit Per Project (2026) — Best for: FMI margin benchmarks, cost-code setup, closeout workflows, and labor overrun data.
- Project Budget vs Actual Analysis: How to Spot Profit Leaks Before They Kill Your Margins — Best for: weekly health-check templates, committed-cost frameworks, and the five-stage variance analysis process.
- Budget vs Actual Example: Where Contractors Lose Control — Best for: a worked example with cost codes, controllable versus uncontrollable cost separation, and root-cause analysis.
- Construction Job Costing: 2026 Guide for Contractors — Best for: software selection criteria and the case for moving off spreadsheets.
- Contractor Profit and Loss Statement: How to Read and Use It — Best for: understanding the relationship between company P&L and job-level diagnostics.