
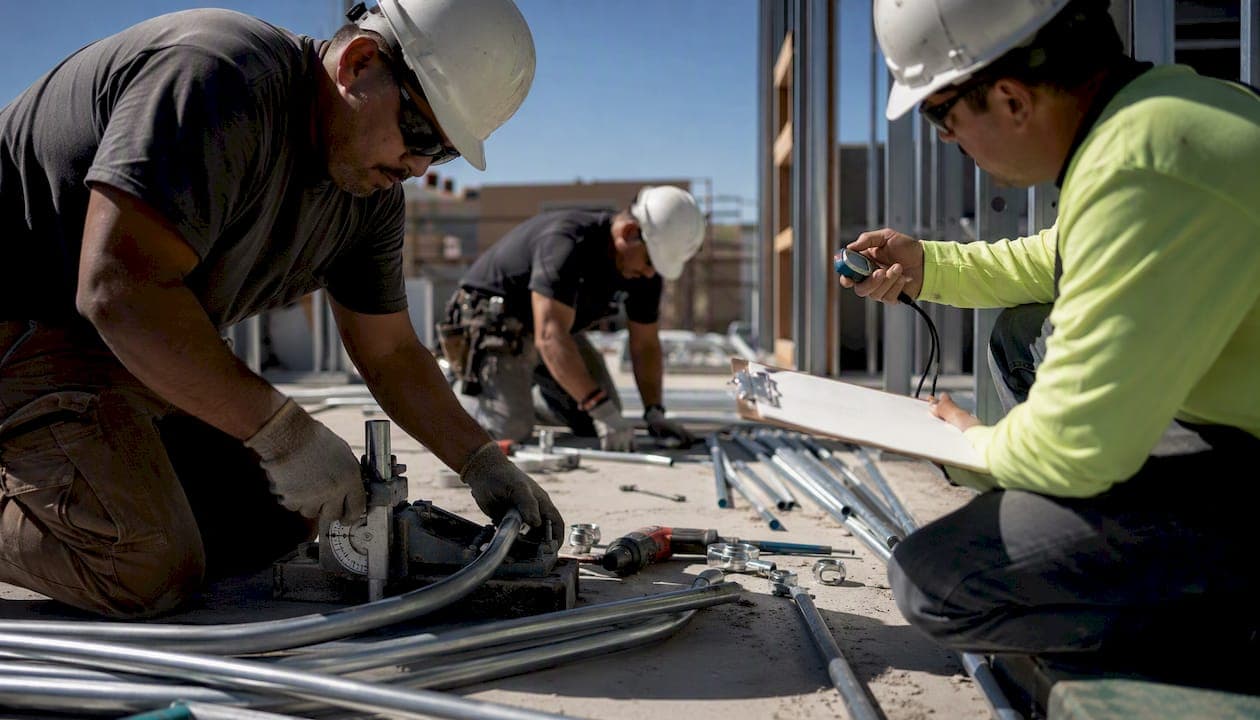
The most practical approach for specialty trade subcontractors is a hybrid model: track output-based rates (units installed per crew-hour) for repeatable tasks, then run targeted field observations using Crew Balance Charts (CBCs) and activity sampling to diagnose why numbers drift. That combination gives estimators a defensible labor unit and gives PMs a tool to fix the problem, not just spot it. The Bureau of Labor Statistics defines labor productivity as output divided by labor input hours, which is the same formula your foreman already uses when he says "we hung 40 fixtures today with four guys." The CMAA's Crew Balance Study and ASCE best-practice guidance both endorse this paired approach for field construction work.
To get started this week, you need three things: a consistent way to capture installed quantities by crew, a simple observation form for one cyclical task, and a daily delay log. Everything else builds from there.
Start with these core components:
- Output metric: installed units per crew-hour for two repeatable tasks (e.g., conduit feet per journeyman-hour on an electrical job, or linear feet of copper pipe per plumber-hour)
- Field technique: one Crew Balance Chart on a cyclical activity (fixture installation, pipe threading, drywall hanging)
- Delay log: five-minute end-of-day notes from the foreman: what stopped the crew and for how long
- Reference baseline: compare your numbers against BLS construction labor data and any historical job-cost actuals you have
Table of Contents
- What to start tracking this week
- Measurement methods explained: output-based, input-based, and hybrid
- Field data collection: timecards, activity sampling, delay surveys, and Crew Balance Charts
- Which metrics and KPIs specialty trade firms should track
- Common pitfalls when measuring crew productivity and how to avoid them
- Practical templates and worked examples
- How to validate your measurement program and present results credibly
- What I've learned from running small trade crews
- Subascent helps specialty subs measure crew productivity without the overhead
- Useful sources and further reading
What to start tracking this week
You do not need a new software platform or a consultant to get useful data. Three focused actions this week will give you more than most firms collect in a year.
1. Pick two repeatable tasks and capture units per crew-hour. Choose tasks your crew does on every job: conduit runs, pipe hangs, drywall sheets, roofing squares, or masonry block count. Ask the foreman to note start time, finish time, crew size, and quantity installed at the end of each task. That is it. No app required yet.
2. Run one Crew Balance Chart on a cyclical activity. Pick a task that repeats in a predictable cycle, like installing a conduit run from panel to junction box. Stand back and observe three to five complete cycles. Record what each crew member is doing every 30 seconds: working, waiting, traveling, or handling materials. You will see patterns within the first two cycles.
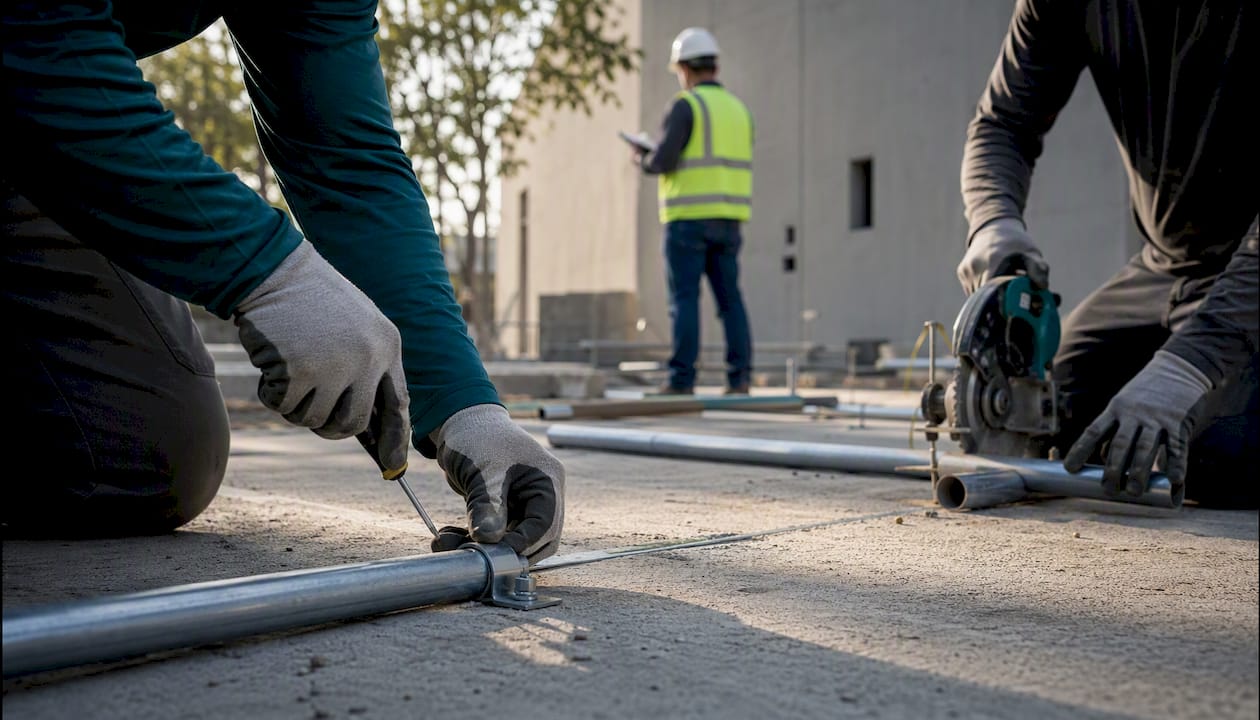
3. Start a daily delay log. Give the foreman a half-sheet form (or a voice memo habit) to capture delays longer than 15 minutes: waiting for RFIs, material not on site, equipment not available, inspection hold. One line per delay, with duration. After two weeks, you will know exactly where your labor hours are going.
Who reviews the data: The PM pulls the numbers every Friday. After two weeks, share a one-page summary with the foreman before making any changes. That conversation matters more than the data itself.
Pro Tip: Frame the tracking to your foreman as "we're trying to find what's slowing you down, not grade your performance." Firms that show crews specific time losses, like two hours a day waiting on RFIs, shift the conversation from "work harder" to "let's fix the obstacle." Buy-in follows quickly when the data helps the crew, not just management.
Measurement methods explained: output-based, input-based, and hybrid
The three measurement families each answer a different question. Knowing which to use for a given task saves you from collecting data that does not actually help.
Output-based measurement counts what gets installed per unit of labor time. Examples: conduit feet installed per journeyman-hour, linear feet of copper pipe per plumber-hour, roofing squares per crew-day, masonry block per mason-hour. This method works best for repetitive, measurable tasks where the unit of work is clear and consistent. It feeds directly into estimating because your labor unit is the output rate.
Input-based measurement tracks labor hours consumed against a planned budget. You compare actual crew-hours to estimated crew-hours for a scope of work. It tells you whether you are over or under budget but not why. Useful for job-cost control, less useful for diagnosing field problems.
Hybrid measurement combines both. You track units installed (output) and crew-hours (input) simultaneously, then layer in field observation to explain the gap when actual rates fall short of estimated rates. The CMAA Crew Balance Study recommends pairing quantitative metrics with qualitative work-face observation precisely because numbers alone rarely reveal the cause of a productivity shortfall.
Two trade examples:
- Electrical: An electrical sub tracks conduit feet installed per journeyman-hour on EMT runs. Output-based measurement works well here because the task is repetitive and the unit is unambiguous. When the rate drops on a new job, a CBC reveals that journeymen are spending 35% of their time retrieving material from a staging area 200 feet away. The fix is a closer staging point, not more workers.
- Plumbing: A plumbing sub tracks linear feet of 2" copper per crew-hour on a multi-floor commercial job. The rate varies by floor because pipe lengths and fitting counts differ. A hybrid approach, output rate plus a delay survey, shows that floors 3–5 have longer waits for inspection sign-off before the crew can proceed. That is a scheduling fix, not a crew fix.
| Dimension | Output-based | Input-based | Hybrid |
|---|---|---|---|
| Best for | Repetitive, measurable tasks | Budget tracking, job costing | Complex tasks, multi-trade handoffs |
| Data collection effort | Low to medium | Low | Medium to high |
| Accuracy for estimating | High | Moderate | High |
| Bias risk | Quantity inflation | Hour padding | Lower when triangulated |
| Reveals root cause | Rarely | No | Yes |
When tasks involve multiple trades handing off to each other, like framing followed by drywall, or rough-in followed by finish plumbing, the hybrid approach is the only one that captures the full picture. Output rates alone will not show you that the drywall crew is waiting on the framing inspection.
Field data collection: timecards, activity sampling, delay surveys, and Crew Balance Charts
Four techniques cover most of what specialty subs need. Each has a specific use case, and combining two or three of them produces far more reliable data than any single method.
Timecards
Timecards capture labor hours by task code. The key is task-level coding, not just total hours. A timecard that says "8 hours, job 1042" is useless for productivity analysis. A timecard that says "3 hours rough-in, 2 hours trim-out, 1.5 hours material handling, 1.5 hours travel/wait" gives you something to work with. See how foremen track crew hours for practical capture methods that do not require a smartphone.
Activity sampling
An observer walks the site at random intervals (every 10–15 minutes) and records what each crew member is doing at that exact moment: direct work, indirect work (material handling, tool retrieval), or non-productive time (waiting, idle). After 30–40 observations, the percentages stabilize and give you a reliable picture of how the crew's time is distributed. No continuous watching required.
Delay surveys
At the end of each shift, the foreman answers five to eight structured questions: Did the crew wait for materials? For inspections? For another trade to clear the area? How long? A simple paper form or a phone-based form works fine. After two weeks, the delay categories sort themselves by frequency and duration, and you know exactly which obstacles to attack first.
Crew Balance Charts: step-by-step
The CMAA Crew Balance Study outlines the CBC process clearly. Here is how to run one for a specialty trade task:
- Identify a cyclical task. Pick something that repeats: installing a conduit run, hanging a VAV box, setting a toilet rough-in, hanging a sheet of drywall. The task must have a clear start and end point.
- Define crew members and subtasks. List each person by role (journeyman, apprentice, helper) and the subtasks involved (measure and cut, thread/bend, carry, connect, inspect).
- Observe multiple cycles. Watch three to five complete cycles. Every 30 seconds, note what each person is doing. Use a simple tally sheet: one column per person, rows for each 30-second interval.
- Classify each observation. Group activities into: contributory work (direct installation), indirect work (material handling, tool prep), and non-contributory time (waiting, idle, rework).
- Build the chart. Create a horizontal bar chart with one bar per crew member. Each bar shows the percentage of time in each category. Stack them side by side.
- Analyze for imbalance. Look for crew members with high non-contributory percentages. Look for sequential bottlenecks where one person is always waiting for another to finish.
- Propose changes. Re-sequence tasks, adjust role assignments, pre-stage materials, or change tool placement. Then re-run the CBC after the change to confirm improvement.
CBC template fields to capture:
- Job name, date, task observed, observer name
- Crew members (role, not name, for privacy)
- Cycle start/end times
- 30-second interval tally per person (contributory / indirect / non-contributory)
- Notes on delays, interruptions, or unusual conditions
Pro Tip: Tell the crew before you observe: "I'm timing the task, not grading anyone." Then share what you find with the foreman before making any changes. Crews that see the chart and recognize their own bottlenecks become the best source of improvement ideas.
Which metrics and KPIs specialty trade firms should track
Six KPIs cover the full picture for most specialty subs. The first two feed estimating; the rest drive daily operations.
- Units per crew-hour: The core estimating metric. Formula: total units installed ÷ total crew-hours worked on that task. Example: 1,000 linear feet of conduit installed by a three-person crew over 200 crew-hours = 5 LF per crew-hour. This is the BLS labor productivity formula applied directly to field work.
- Productive time %: From activity sampling or CBC data. Formula: (contributory work observations ÷ total observations) × 100. A crew spending 55% of observed time on direct work is not unusual on a constrained site; 70%+ is a realistic target for well-managed tasks.
- Crew utilization: Planned crew-hours ÷ available crew-hours. Tells you whether you are deploying the right crew size for the scope on site.
- First-pass quality rate: Units installed that pass inspection on the first attempt ÷ total units installed. Rework is a hidden productivity killer; tracking it separately prevents it from hiding inside "hours worked."
- Rework hours: Total hours spent correcting defective work. Track separately from productive hours. Even a small rework percentage compounds quickly on a large job.
- Delay minutes per shift: From the daily delay log. Aggregate by category (material, RFI, inspection, other trade) weekly to identify the highest-impact obstacle.
Worked example for an electrical pull-and-terminate task:
A four-person electrical crew (two journeymen, two apprentices) installs branch circuit wiring on a commercial tenant improvement. Over five days, they log 160 crew-hours and complete 800 circuits.
- Units per crew-hour: 800 ÷ 160 = 5.0 circuits per crew-hour
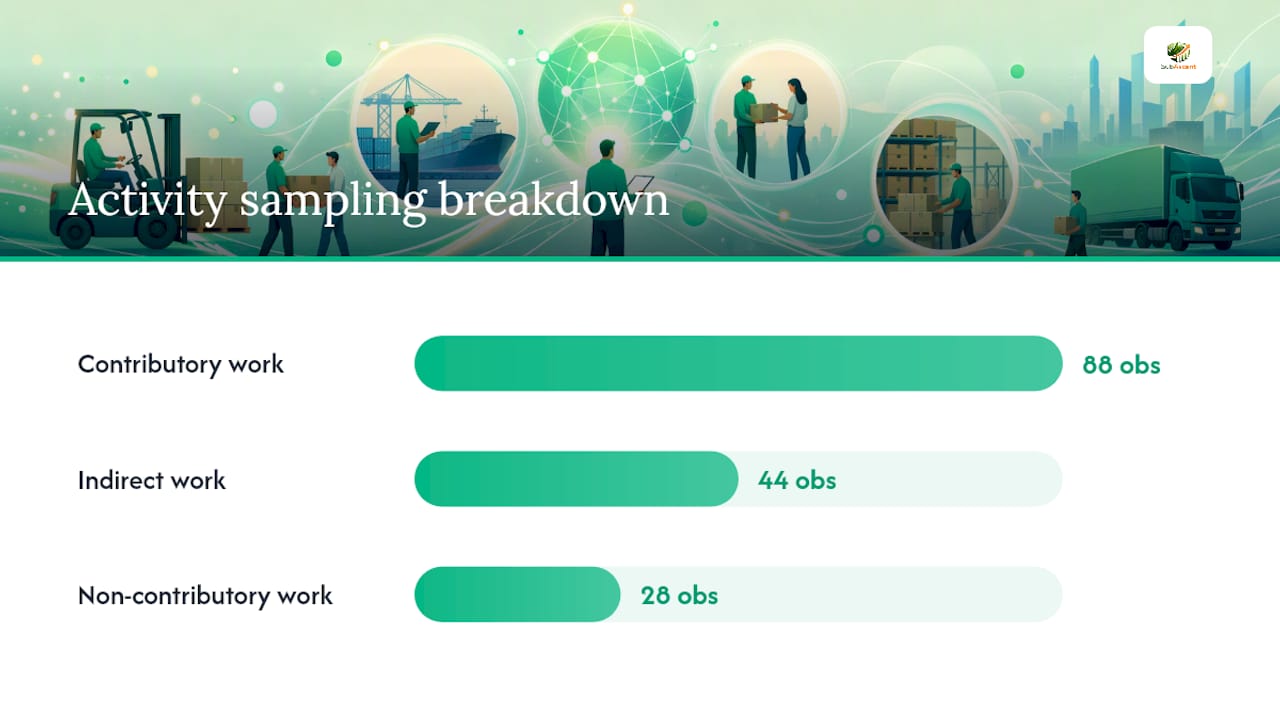
- Activity sampling (40 observations per person, 160 total): 88 contributory, 44 indirect, 28 non-contributory
- Productive time %: (88 ÷ 160) × 100 = 55%
- Delay log shows 14 hours of non-contributory time split between waiting for panel schedule RFI (9 hours) and material not on site (5 hours)
The PM now knows the crew's output rate for estimating future tenant improvement bids and knows that RFI turnaround time is the single biggest drag on productive hours. That is two actionable outputs from one week of simple tracking.
KPI research from 2024 confirms that productivity and cost-focused KPIs improve operational efficiency, with effectiveness varying by firm size and market conditions, which is why tailoring your KPI set to your trade and crew size matters more than copying a generic list.
Common pitfalls when measuring crew productivity and how to avoid them
Most measurement programs fail for one of four reasons, and none of them are technical.
Overreliance on timecards alone. Timecards tell you hours consumed; they do not tell you what happened during those hours. A crew that logs eight hours but spent three waiting for a material delivery looks identical on a timecard to a crew that worked eight productive hours. Triangulate with at least one observational technique.
Poor sampling design. Measuring one crew on one day and treating the result as a firm-wide benchmark is a common mistake. Conditions vary by job, by season, and by crew composition. Sample across multiple jobs and multiple weeks before updating a labor unit.
Misreading "busy" as "productive." A crew moving materials, searching for tools, or redoing work is busy but not productive. Activity sampling distinguishes between the two; timecards do not. Research on construction labor productivity and teamwork shows that behavioral and team-dynamic factors, not just physical effort, drive output, which means a crew that looks busy may be working around a management or sequencing problem.
Using productivity data for discipline. If crews believe measurement leads to punishment, they will game the data. Foremen will coach crews before observations, delay logs will go blank, and timecard task codes will become meaningless. The data must be used to remove obstacles, not to build a case against individuals.
HR and privacy considerations: In a non-union shop, continuous monitoring of individual workers (GPS tracking, keystroke-level time logging) can create legal exposure and erode trust. Focus measurement on task-level and crew-level data, not individual surveillance. In union environments, check your CBA before implementing any new monitoring program. Transparent communication about what is being measured, why, and how the data will be used is the single best protection against both legal risk and crew resistance.
Pro Tip: Crew evaluation best practices from structured industries recommend using a standardized scoring approach with written assessor comments rather than raw numbers alone. The same principle applies on a job site: pair your CBC data with a short written note on site conditions, crew composition, and any unusual factors. A number without context is easy to misuse.
Practical templates and worked examples
Filled CBC example: installing 20 conduit runs (electrical)
Task: EMT conduit run, panel to junction box, average 40 LF per run Crew: 2 journeymen (J1, J2), 1 apprentice (A1) Cycles observed: 5 complete runs Observation interval: 30 seconds
| Crew member | Contributory work | Indirect work | Non-contributory | Total observations |
|---|---|---|---|---|
| J1 (lead) | 62% | 22% | 16% | 40 |
| J2 (assist) | 48% | 18% | 34% | 40 |
| A1 (helper) | 30% | 55% | 15% | 40 |
What the chart reveals: J2 has 34% non-contributory time, mostly waiting while J1 measures and marks. A1 spends 55% on indirect work (carrying conduit, retrieving fittings), which is appropriate for a helper role but suggests the staging area is too far from the work face.
Calculations:
- 5 runs × 40 LF = 200 LF installed
- Crew-hours: 3 people × 2.5 hours per run × 5 runs = 37.5 crew-hours
- Units per crew-hour: 200 LF ÷ 37.5 = 5.3 LF per crew-hour
- Crew productive time %: (62 + 48 + 30) ÷ (3 × 100) = 140 ÷ 300 = 47%
The 47% productive time is below a reasonable target of 60–65% for this task type. The CBC points directly at J2's wait time as the first fix: pre-marking conduit runs before the crew starts, or assigning J2 a parallel subtask during J1's measuring phase.
Adapting templates for other trades:
- Plumbing: Replace "conduit run" with "pipe spool assembly." Subtasks: cut, deburr, fit, solder/press, inspect.
- Masonry: Replace with "block course." Subtasks: lay mortar, set block, check level, joint, move to next position.
- Drywall: Replace with "sheet hang." Subtasks: measure/cut, carry, position, fasten, tape.
For labor unit calculations specific to masonry estimating, the same units-per-crew-hour formula applies directly to your estimating workbook.
Download a printable CBC form and CSV template from the Subascent resource library, or copy the table structure above into a Google Sheet for immediate field use.
How to validate your measurement program and present results credibly
A productivity number is only as good as the process that produced it. Before you use a measured rate in a bid or present it to an owner, run through this validation checklist.
Validation checklist:
- Sample traceability: can you identify which job, which crew, which dates, and which observer produced each data point?
- Observer training: did the observer use the same classification rules (contributory / indirect / non-contributory) consistently? Document the definitions used.
- Replication: does the rate hold across at least two separate measurement periods or two different crews on the same task type?
- Outlier handling: are outlier cycles documented and excluded with a written reason?
- Variance check: is the standard deviation of your cycle times small enough that the average is meaningful? Wide variance means the task is too inconsistent to benchmark reliably.
What to include on a results summary for internal use:
- Method used (CBC, activity sampling, timecard analysis, or combination)
- Sample size (number of cycles, number of observations, number of crew-hours covered)
- Confidence statement: "Based on five observed cycles across two weeks, this rate is reliable for similar tasks on comparable sites. Recommend re-sampling if site conditions change significantly."
- Recommended change and expected impact (specific, not vague)
- Authority references: CMAA Crew Balance Study for field technique validation, BLS labor productivity framework for formula definitions
Structured evaluation programs in other industries consistently show that standardized scoring and written assessor comments produce more comparable, actionable data than raw numbers alone. The same principle applies here: a results summary with method, sample size, and a written confidence statement is far more credible than a single number on a whiteboard.
What I've learned from running small trade crews
The conventional wisdom says measurement programs fail because of technology or data quality. In practice, they fail because of the first conversation the PM has with the foreman about why the clipboard is coming out.
Every time a measurement program has worked well, the foreman understood from day one that the data was going to be used to remove obstacles, not build a case. The CBC result that showed J2 waiting 34% of the time on conduit runs did not get presented as "J2 is underperforming." It got presented as "the sequencing is wrong, and here is how we fix it." That framing is the difference between a foreman who fills out the delay log every day and one who loses the form.
The other thing most articles miss: the biggest productivity gains rarely come from the crew working harder. They come from the PM working smarter on staging, sequencing, and RFI turnaround. A CBC almost always reveals a management problem wearing a crew problem's clothing. The masonry crew waiting 12 minutes per course for block is not a lazy crew. It is a staging decision that nobody questioned until someone timed it.
Research on construction labor productivity and teamwork backs this up: team behavioral dynamics and process factors explain productivity variation at least as much as individual effort. That means your measurement program needs to look at the system, not just the people in it.
Start with one CBC on one task. Share the chart with your foreman before you share it with anyone else. Let the crew propose the fix. You will get better ideas than you would have come up with alone, and you will have a foreman who actually wants to run the next one.
Subascent helps specialty subs measure crew productivity without the overhead
Specialty trade firms that want to move from gut-feel labor units to verified field data need two things: a way to capture task-level hours from foremen without friction, and a way to connect those hours to job-cost actuals in real time. That is exactly what Subascent is built for.

Subascent's CrewTrack mobile app lets foremen log task codes, quantities installed, and delay notes from the job site, offline if needed, with a sync that feeds directly into job analytics. PMs see budget-versus-actual labor hours updated daily, not at month-end. The QuickBooks sync means your accountant and your PM are looking at the same numbers. And because Subascent is built specifically for specialty trade subs, not general contractors, the task codes, trade workflows, and reporting views match how electrical, plumbing, HVAC, masonry, and drywall firms actually work.
A 30-day pilot takes less than an hour to set up. Pick one crew, two task types, and let CrewTrack capture the data this guide describes. At day 30, compare your measured units-per-hour rate to your last bid assumption for the same task. That gap is your first win.
Start your free trial at Subascent.com and have your first crew logging task hours by end of week.
Useful sources and further reading
These are the sources worth bookmarking if you want to go deeper on any part of this measurement program.
-
CMAA Crew Balance Study: The most practical field reference for CBC methodology, activity sampling, and delay surveys in construction. Consult this first for sampling rules and field technique design. It also covers how to convert CBC findings into process changes.
-
BLS Labor Productivity Framework: Plain-language explanation of the output-per-labor-hour formula. Use this to anchor your KPI definitions and explain the math to owners or GCs who ask how you calculated your labor units.
-
Construction Labour Productivity and Teamwork (2020): Academic research on how team behavioral factors influence crew output. Useful when your numbers look fine but performance is still inconsistent. Explains why crew composition and team dynamics belong in any serious productivity analysis.
-
KPI Impact on Operational Efficiency (2024): Panel data research on how productivity and cost KPIs affect firm efficiency. Supports the case for tailoring KPI selection to firm size. Reference this when presenting your measurement program to ownership.
-
Crew Evaluation Best Practices (Sealogic): Structured evaluation design from a field-intensive industry. Covers scoring scales, assessor consistency, and self-assessment components. Adapt the evaluation design principles for your observer training and results documentation.
-
Behavior Competency Crew Assessment Tool (VENLYS): Practical guidance on piloting structured assessment tools, training observers, and building continuous monitoring into operations. Use this as a reference when designing your 30-day technology pilot and observer training protocol.