

A productivity factor is the multiplier or unit-rate rule you use to convert a takeoff quantity into labor hours, then adjust those hours for real-world conditions like crew experience, site access, height, and schedule compression. Understanding how labor productivity factors work is the difference between a bid that holds margin and one that bleeds it quietly until closeout. Labor typically runs 30–50% of direct project cost, so a 10% variance against your estimate can move net margin by 250–500 basis points on a $5M subcontractor. Start here: pull one representative line item from your current bid, confirm its base production rate from your most recent comparable job, and lock that rate in as the measurable target before you do anything else.
Key Takeaways
Productivity factors only protect margin when the bid rate, the field measurement, and the estimating update are all connected in a single closed loop.
| Point | Details |
|---|---|
| Labor is the highest-leverage cost | A 10% productivity variance moves net margin by 250–500 bps on a $5M subcontractor. |
| Combined factors multiply, not add | Stack renovation (1.25) and scaffolding (1.25), and you get 1.56, not 1.50. |
| Cost-code granularity is non-negotiable | Project-level hours hide the line items that are actually bleeding margin. |
| Weekly field capture beats monthly | Catching a 15% variance in week 2 leaves time to act; catching it at closeout does not. |
| Subascent closes the loop | Estimate units, CrewTrack field logs, and variance reports live in one place for specialty trades. |
Table of Contents
- What do the key estimating terms actually mean?
- What goes into a productivity factor?
- How do you turn takeoff quantities into labor hours?
- Quick reference: base production units by trade
- How does the closed-loop workflow actually run?
- What should you measure in the field, and how often?
- Common mistakes that kill margin
- Checklist for estimators, PMs, and foremen
- The feedback loop is the product
- Subascent keeps the closed loop in one place
- Sources
What do the key estimating terms actually mean?
Before you can apply factors correctly, you need a shared vocabulary. These terms come up constantly in estimating and field tracking, and mixing them up is one of the fastest ways to build a bad bid.
- Base production rate: The rate a standard crew achieves under normal conditions, expressed as units per labor hour (units/LH) or its inverse, labor hours per unit (LH/unit). A drywall crew hanging 80 SF/LH has a base rate of 0.0125 LH/SF.
- Labor hours vs. crew hours: Labor hours count every worker's time individually. Crew hours count elapsed time for the whole crew. A 4-person crew working 8 hours logs 32 labor hours but 8 crew hours. Your bid formula needs to be consistent about which one it uses.
- Productivity factor (multiplier): A decimal that scales the base rate up or down. A factor of 1.20 means the work takes 20% more labor hours than the base rate predicts. Factors below 1.0 mean the crew is running faster than base, which happens with prefabrication or strong repetition.
- Labor unit: The full scope included in one unit of installation, covering setup, cleanup, material handling, and supervision allocation, not just the physical installation motion. If your base rate excludes material handling and you forget to add it back, you are underestimating every time.
Published productivity expressions include crew hours per task, LH/SF, LH/LF, and units/LH. Pick one expression per line item and stay consistent across your estimating table.
What goes into a productivity factor?
A productivity factor is rarely a single number. Most bids require you to stack several multipliers, each tied to a specific observable condition.
Common multiplier categories:
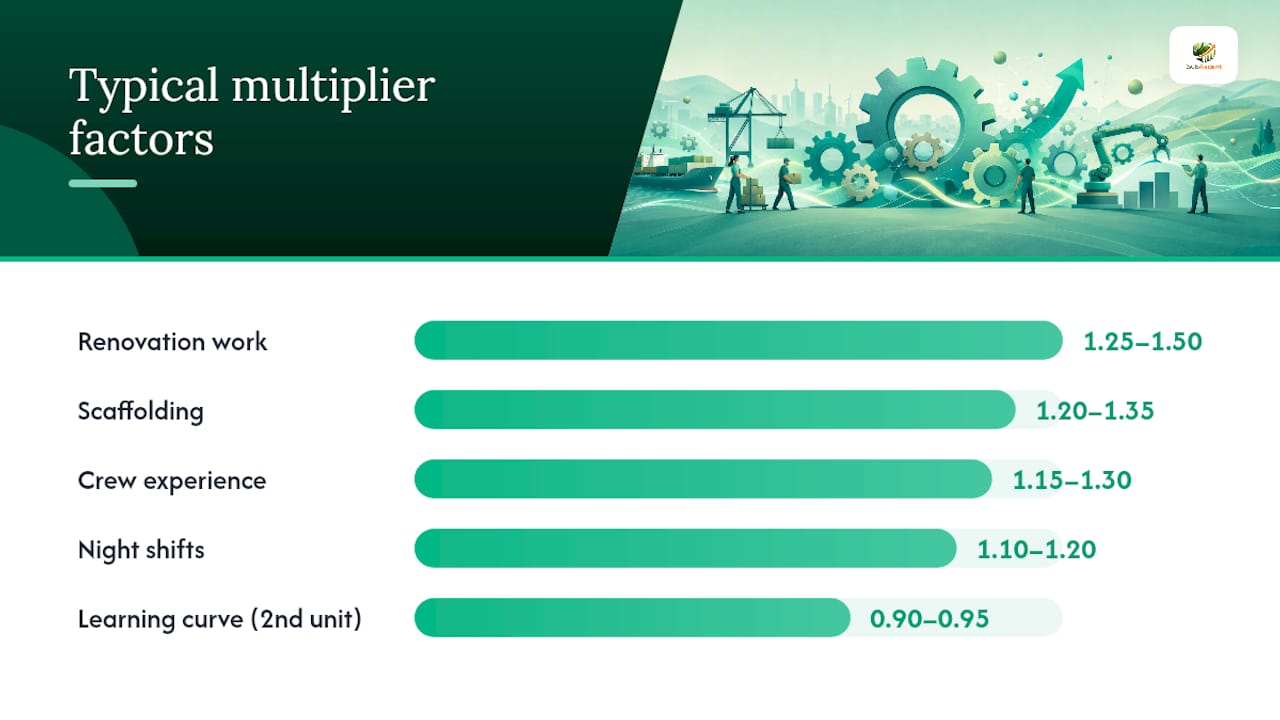
- Site conditions and access: Congested urban sites, limited staging, or restricted entry points slow crews. Renovation work typically carries a factor of 1.25–1.50 over new construction.
- Height and elevation: Work above 15 feet adds ladder or scaffold time. Scaffolding alone can add a factor of 1.20–1.35 depending on setup complexity.
- Material handling and staging: If the base rate excludes material handling, you need a separate multiplier. Hoisting to upper floors or long horizontal carries from a remote laydown area both add time.
- Crew experience and skill: A green crew on an unfamiliar scope can run 1.15–1.30 over a seasoned crew. Document this when you apply it.
- Schedule compression and overtime: Sustained 50-hour weeks produce stepwise productivity declines that you should model as a schedule-compression multiplier, not ignore. Overtime pay costs more and the crew produces less per hour.
- Shift and time-of-day: Night shifts and split shifts typically carry a 1.10–1.20 factor due to reduced supervision and coordination friction.
- Learning curve and repetition: Repetitive scopes improve over time. The second unit of a repetitive task often runs at 0.90–0.95 of the first; the fourth unit at 0.85–0.90. Apply learning-curve credits on long repetitive runs like multi-floor electrical rough-in.
- Prefabrication and mechanization: Prefabbed assemblies or power tools that replace manual work can push factors below 1.0, sometimes to 0.80–0.90 on well-run scopes.
Combined factor = product of all applicable multipliers. A job with a renovation factor of 1.30 and a scaffolding factor of 1.25 carries a combined factor of 1.625. That is not a rounding error. It is a real cost.
When combined factors exceed 1.50, stop and rationalize each component. Large undocumented buffers are a red flag in any bid review. The goal is small, justified adjustments tied to observable conditions, not a single large "safety" number that nobody can explain later.
Pro Tip: Every multiplier you apply should have a one-line note in your estimating file explaining what condition drove it. If you cannot write that note, you probably should not be applying the factor.
How do you turn takeoff quantities into labor hours?
The core formula is straightforward:
Adjusted LH = Quantity × Base LH/unit × Combined multiplier
If your base rate is expressed as units/LH, convert first: LH/unit = 1 ÷ (units/LH).
Worked example: drywall rough-in, 4,800 SF
- Takeoff quantity: 4,800 SF
- Base rate: 0.014 LH/SF (roughly 71 SF/LH for a standard 4-person crew on 5/8" drywall)
- Base labor hours: 4,800 × 0.014 = 67.2 LH
- Multipliers: renovation building (1.25) × scaffolding above 14 ft (1.20) = 1.50 combined
- Adjusted labor hours: 67.2 × 1.50 = 100.8 LH
- Crew hours: 100.8 ÷ 4 crew = 25.2 crew hours
- Burdened labor rate: $68/LH (wages + burden + small tools + pro-rated foreman per labor unit cost guidance)
- Total labor cost: 100.8 × $68 = $6,854
A complete labor unit cost must include direct wages, labor burden, a productivity factor, small-tool allowance, and a pro-rated foreman allocation. Leaving any of those out inflates margin risk.
| Calculation row | Value |
|---|---|
| Takeoff quantity | 4,800 SF |
| Base LH/unit | 0.014 LH/SF |
| Base labor hours | 67.2 LH |
| Combined multiplier | 1.50 |
| Adjusted labor hours | 100.8 LH |
| Burdened labor rate | $68/LH |
| Total labor cost | $6,854 |
Quick reference: base production units by trade
These are starting-point ranges. Your historical data should override them whenever you have at least three comparable completed jobs. Published calculators are useful sanity checks but must be traced to their source row, included tasks, and crew assumptions before you rely on them.
Glazing and rebar on congested sites carry the widest variance in the table. If you are bidding either without recent actuals, add a contingency note to the bid rather than guessing at the high end.
How does the closed-loop workflow actually run?
The Construction CFO's four-step closed loop is the operational fix for persistent margin loss: establish rates at bid, track weekly in the field by cost code, analyze variance monthly, and update estimating tables quarterly.
- Establish production rates at bid. For every major line item, record the base rate, the multipliers applied, and the source (your own actuals, a published reference, or an estimate). This becomes the field target.
- Capture weekly field production by cost code. Foremen log installed quantity and craft hours against each cost code, not just total project hours. Weekly capture means you catch a problem in week 2, not at closeout.
- Run monthly cost-code variance analysis. Compare actual LH/unit to bid LH/unit for each cost code. A line item running 20% over budget in month 1 needs a corrective action, not a note in the final job review.
- Update estimating tables quarterly. Feed the actuals from completed jobs back into your base rates. Start with your most recent 3–5 comparable completed projects rather than industry benchmarks alone.
Roles matter here. Foremen capture daily quantities and hours. PMs verify weekly and flag variances. Estimators own the quarterly update. Owners review the monthly P&L impact. Nobody does all four steps alone.
Pro Tip: Seed your estimating tables from your own last 3–5 comparable jobs before you touch any published reference. Your actuals already reflect your crew, your market, and your typical site conditions.
What should you measure in the field, and how often?
Daily capture is the minimum. Weekly review is where the decisions happen.
Essential field metrics by cost code:
- Installed quantity (SF, LF, units, tons) by cost code
- Craft hours by cost code, separated by trade classification
- Crew composition (headcount and classification)
- Overtime hours, flagged separately
- Rework hours, logged with a brief cause note
- Weather or access events that stopped or slowed work
- Equipment or dedicated tool time that affects the labor calculation
Collection methods that actually work:
- Mobile daily logs tied to cost codes (a crew tracking app that foremen can complete in under five minutes)
- Foreman timecards with cost-code fields, not just total hours
- Weekly PM verification against the schedule and the bid quantities
- Photo-tagged quantity proof for installed work that is hard to remeasure later
Foreman timecard discipline is the single biggest gap in most specialty trade operations. A foreman who logs hours to "general labor" instead of a cost code makes monthly variance analysis nearly impossible. Fix the timecard before you fix the estimate.
Staffing the right crew composition also affects what you measure. Mechanical construction staffing decisions made before mobilization directly shape the crew-hour denominators you will track all job long.
Common mistakes that kill margin
Labor deviations affect equipment, general conditions, and other cost categories too, which is why fixing labor tracking gives you more diagnostic leverage than any other single change.
Mistakes to stop making:
- Using base rates from a job completed three or more years ago without adjusting for wage and market changes
- Double-counting scope in both the base rate and a multiplier (e.g., including material handling in the base rate AND applying a separate material-handling factor)
- Stacking multipliers to a combined factor above 1.60 without a written justification for each component
- Measuring production only at project closeout, when nothing can be corrected
- Logging all labor to a single cost code instead of line-item codes
Red flags that signal a structural problem:
- Consistent variance greater than 15% on the same scope across multiple jobs
- Large swings in actual LH/unit between similar jobs with no documented explanation
- Foreman daily reports that do not reconcile with timecard totals
- Repetitive rework or material staging delays appearing in the same cost codes
When you see a red flag, break the variance by cost code first. Then run a spot audit on the two or three highest-variance codes. Update the estimating table for the affected line item before the next similar bid goes out.
Checklist for estimators, PMs, and foremen
Before the bid (estimators)
- Confirm base rate source and date for every major line item
- Apply only multipliers tied to observable, documented conditions
- Record the combined factor and each component in the estimating file
- Include wages, burden, small tools, and pro-rated supervision in the burdened rate
- Set the field target (adjusted LH/unit) for each cost code
During execution (PMs and foremen)
- Log installed quantity and craft hours by cost code daily
- Separate overtime hours from straight-time hours in the timecard
- Flag rework hours with a cause note the same day
- Run a weekly variance check: actual LH/unit vs. bid LH/unit by cost code
- Escalate any cost code running more than 10% over budget before the next pay period
At closeout (estimators and PMs)
- Export cost-code actuals from the field log
- Compute actual production rate (LH/unit) for each major line item
- Compare to bid rate and document the variance and its cause
- Update the estimating table with the new actuals
- Flag any scope or site condition that should carry a standing multiplier adjustment
Pro Tip: Keep the checklist in the same shared file as your estimating table. If the foreman has to open a separate system to log hours, it will not get done consistently.
The feedback loop is the product
Most estimators set productivity factors once and move on. The ones who actually know which jobs are making money before closeout treat the closed loop as the real deliverable. The bid is a hypothesis. The field data is the test. The quarterly estimating update is where you get smarter.
Subs who fix cost-code-level labor tracking typically reclaim 200–400 basis points of net margin within 12–18 months, not by raising prices, but by bidding more accurately and catching variance early enough to act on it. The math is not complicated. The discipline is.
Subascent keeps the closed loop in one place
Running the bid-to-actual loop across a spreadsheet, a timecard app, and a separate job-cost report means data falls through the gaps every week. Subascent puts estimate units, field production logs, and cost-code variance reports in one place, built specifically for electrical, plumbing, HVAC, drywall, roofing, and the other specialty trades covered in this guide.

Foremen log installed quantities and hours from the field using the CrewTrack mobile app. PMs see the weekly variance against the bid without rebuilding a pivot table. Estimators pull actuals directly into the next bid. The estimating software built for small subs does not require a GC-scale implementation or a long-term contract. Start a free trial at Subascent and run your next job through the closed loop from day one.
Sources
The sources below formed the research base for this guide. Each one is worth bookmarking for a specific task.
- Construction Labor Productivity — How to Track It, Measure It, and Stop Losing Margin to Slow Crews | The Construction CFO
- How to Calculate Labor Productivity in Construction Estimates (2026)
- Labor Unit Costs Construction: A Field Guide for GCs
- Construction Labor-Hour Boundaries
- Analyzing Labor Productivity in Construction Estimates | Vertex